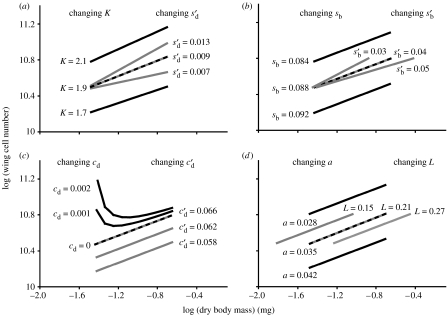
Figure 5.
(a–d) The effect of changing parameter values on the modelled allometry between wing cell number and body size in Drosophila. Dashed line is the predicted wild-type allometry, based on the observed data. Values at the end of each line show the parameter values used; parameter values in black correspond to the black lines and parameter values in grey correspond to the grey lines. All other parameter values are from table 1.

