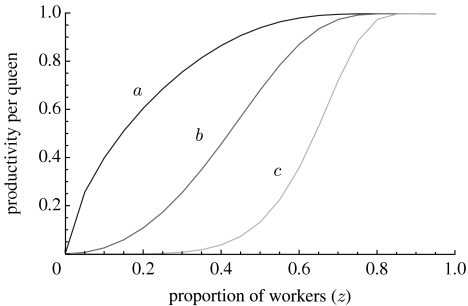
Figure 2.
Productivity function of a queen graphed as a function of the proportion z of workers in a colony. The parameter y (varying between 0 and 1) and ν (varying between 0 and ∞) shape the production function from concave to sigmoidal. As y and ν increase, a higher proportion of workers is needed to achieve a given productivity. In the graph, the values of the parameters are set to y=0.1 for all lines, ν=0.7 for line a, ν=2 for line b and ν=5 for line c.

