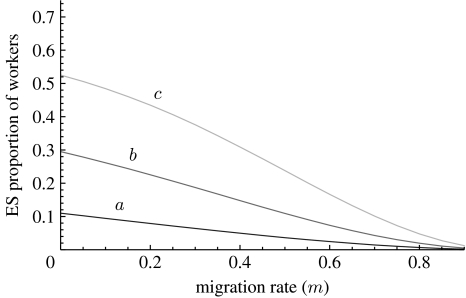
Figure 3.
Candidate ES probability z of developing the worker phenotype as a function of the migration rate m (population viscosity) with the number of queens per colony being set to N=5. The three curves correspond to the productivity functions depicted in figure 2 with the same label.

