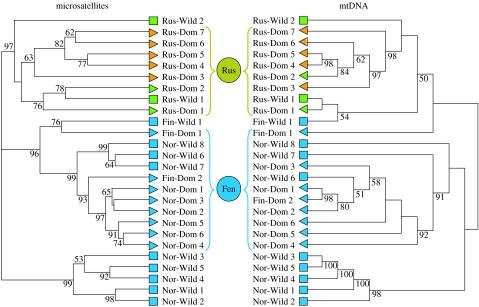
Figure 2.
Population dendrograms as inferred from microsatellite and mtDNA data. Wild and domestic populations are represented by squares and triangles, respectively. Geographical origins are represented by different colours. Blue, Fennoscandia; Orange, western Russia; Green, eastern Russia. Two putative origins for domestication (Russia and Fennoscandia) are indicated by filled circles between the trees.

