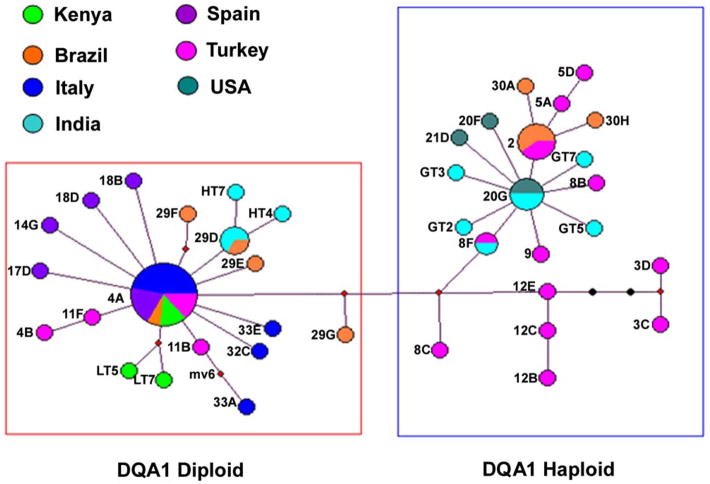
Figure 3. Analysis of mtDNA in CTVT.
Tumor haplotypes from fresh and paraffin-embedded tissues showing two main clusters of mtDNA. Diameter of each circle is proportional to the number of tumor samples. Each branch represents one base pair change, with black dots representing intermediates not found in the tumor samples analyzed. The outlined boxes indicate that tumor samples with homozygous (diploid) and hemizygous (haploid) DQA1 genes coincide with mtDNA clusters, except for tumor 9, which is diploid.

