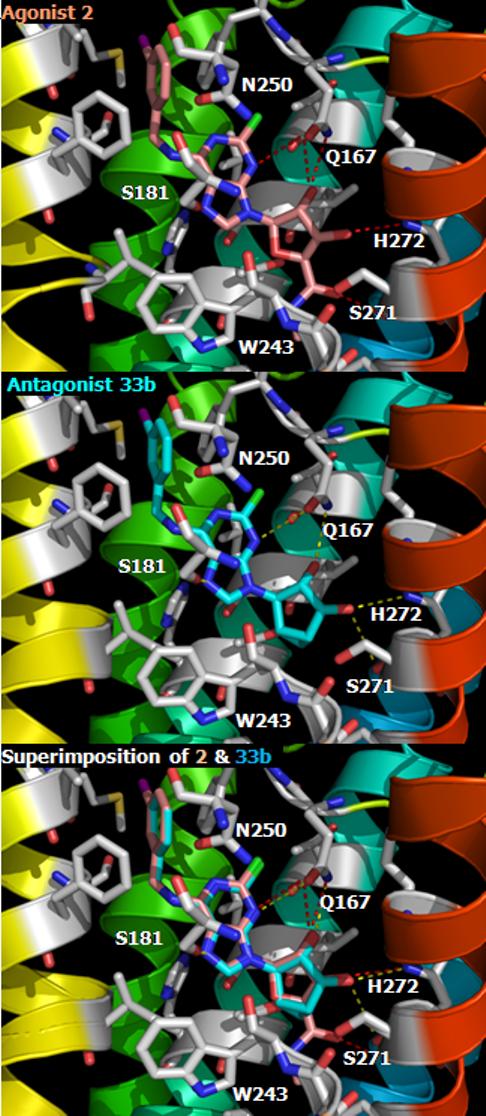
Figure 2.

Docking complexes of A3AR ligands. (A) nucleoside agonist 2, Cl-IB-MECA in light pink color, (B) nucleoside antagonist 33b in cyan color, and (C) the superimposition of agonist 2 and antagonist 33b. Intermolecular H-bonding is indicated with a dotted line. Using Pymol program, all ligands are represented by stick models and the A3AR are shown in ribbon model with different colors for each TM (TM1: purple, TM2: blue, TM3: light blue, TM4: green, TM5: yellow, TM6: orange, TM7: red).
