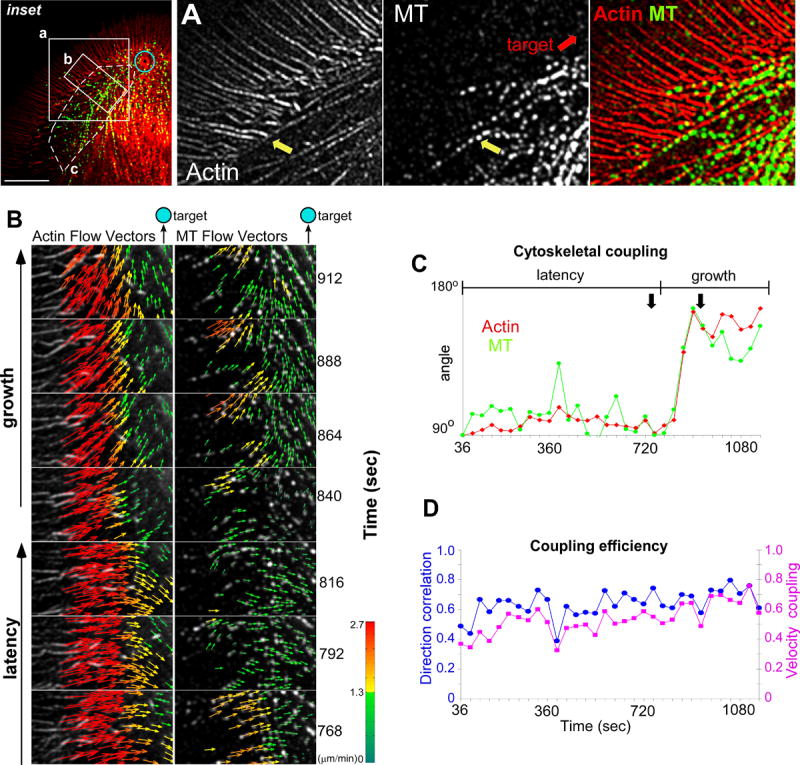
Figure 6. Arcs Guide MTs to Adhesion Site.

(A) Actin (left panel), MTs (middle panel), and actin/MT overlay (right panel) images showing region of interest from inset. Yellow arrow shows co-alignment of arcs and MTs. (B) Time-lapse sequence of a region of interest from inset showing actin channel/ flow vector map (left column) and MT/ flow vector map (right column). (C) Graph shows average direction over time for actin filaments (red diamonds) and MTs (green circles) from the white hatched region of interest in the inset. 90° represents retrograde flow and 180°, flow towards bead site. Double black arrows show time interval from (B). (D) Plots show the DCS (blue circles) and VMCS (purple squares) between the actin and MT speckle features from the same region of interest as (C). A score of one for the coherency and coupling measurements defines vector populations with identical directionality or velocity. Scale bar, 10 μm.
