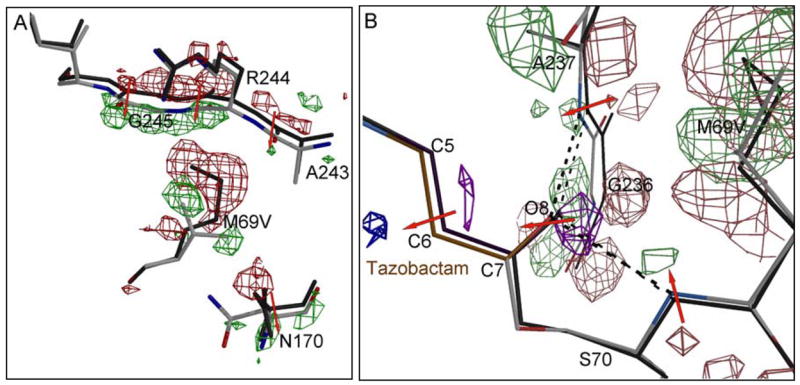
Figure 8.

Crystallographically observed shifts in the vicinity of the M69V mutation. A) the |Fobs, M69V/E166A|-|Fobs, E166A | electron density map is contoured at 3.5 σ (green) and −3.5 σ (red). The direction of atomic shifts is indicated by a red arrow. In addition to the M69V mutation, the shifts in the strand 243–246 is readily observed in the |Fo|-|Fo| map via the positive and negative shifts peaks (phases obtained from the M69V model). The latter strand movement is likely a result of the energetic need to partially fill up the void generated by the M69V mutation. In addition, residue N170 shifted as well to accommodate the branced valine side chain. B) the |Fobs, M69V/E166A|-|Fobs, E166A | electron density map near the oxy-anion hole and acyl-bond is contoured at 3.0 σ and −3.0 σ. Positive and negative shift peaks in the protein are colored green and red, whereas positive and negative shift peaks in tazobactam are colored purple and blue, respectively.
