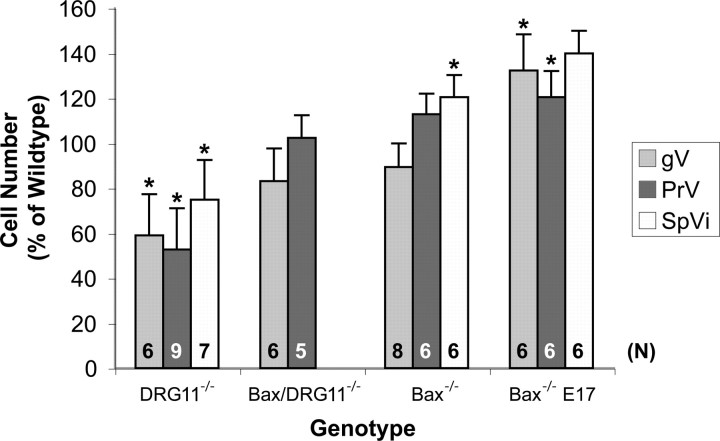
Figure 3.
Histogram of mean (± SD) cell numbers in the V ganglion (gV), PrV, and SpVi from DRG11−/−, Bax/DRG11 double −/−, and Bax−/− cases on the day of birth and Bax−/− mice on E17 as percentages of values obtained from wild-type control cases at matching ages. These wild-type values at birth are 40,829 ± 3755 (n = 8), 48,337 ± 7030 (n = 9), and 6258 ± 1722 (n = 8) for the ganglion, PrV, and SpVi, respectively; on E17, these respective values (n = 6 each) are 36,784 ± 5083, 32,314 ± 6494, and 2639 ± 669. Sample sizes (n) contributing experimental data for each structure in each experimental group are indicated within their respective bars. Note that ganglion and PrV cell numbers reflect the entirety of these structures based on stereological estimates; SpVi numbers reflect the numbers of cell profiles counted in one coronal section at the level of the obex. *p < 0.05, significantly different from wild-type control values.

