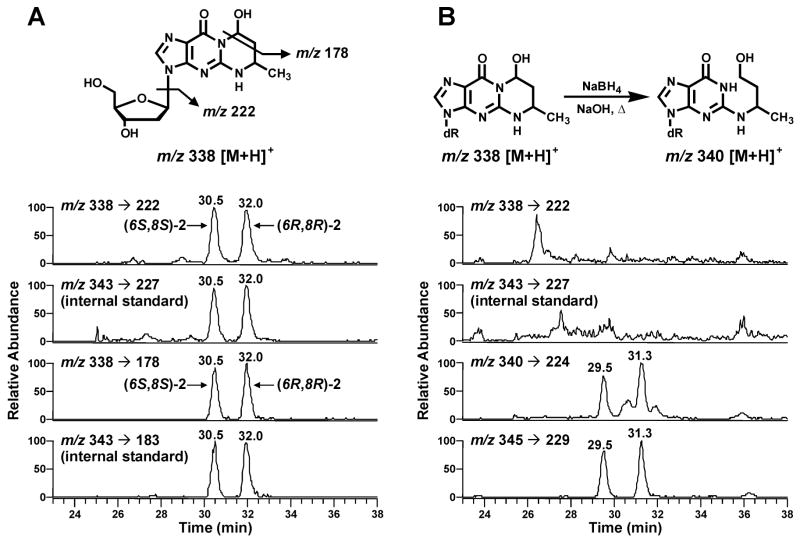
Figure 3.
Chromatograms obtained upon LC-ESI-MS/MS analysis of calf thymus DNA. Calf thymus DNA was enzymatically hydrolyzed, purified by SPE, and analyzed (panel A); or the eluants from SPE were treated with NaOH and NaBH4 and analyzed (panel B). Transitions of m/z 340 → m/z 224 and m/z 345 → m/z 229 correspond to the ring-opened products of the analyte and internal standard, N2-(4-hydroxybut-2-yl)dGuo and [15N5]N2-(4-hydroxybut-2-yl)dGuo, respectively. The early eluting peak was produced from (6R, 8R)-2 and the late eluting peak from (6S, 8S)-2.

