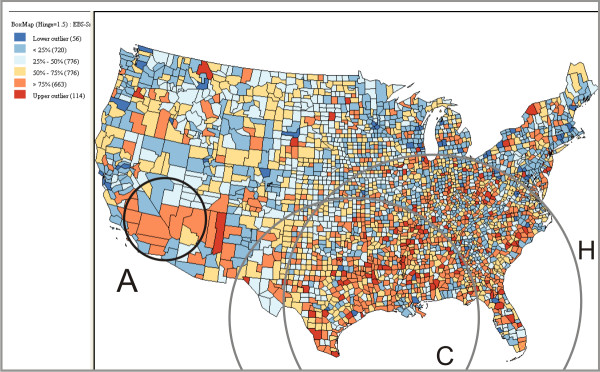
Figure 6.
Smoothed SMR produced by the Empirical Bayes Smoothing method available in GeoDa. For illustration purpose, we draw three circles (A, C, H) that approximately match the cluster A, C and H in Figure 4. The counties with top 25% high SMR (in red and dark orange) are considered in high risk.

