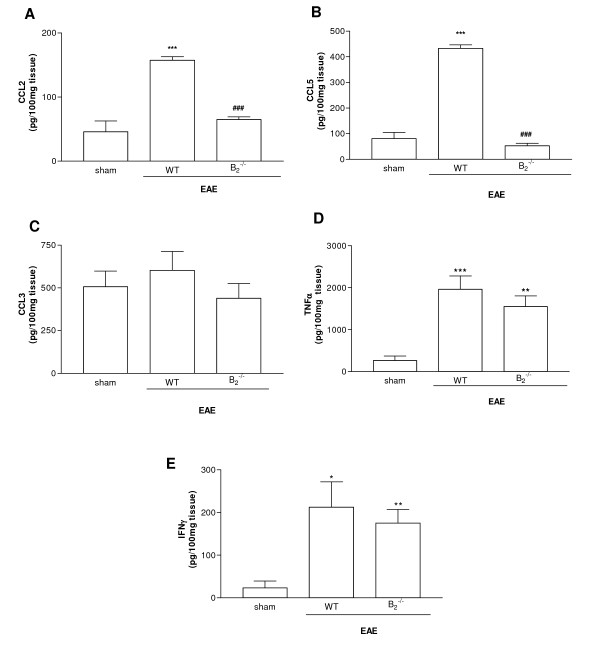
Figure 4.
Kinetics of cytokine and chemokine production in the CNS of EAE mice. Cerebral levels of CCL2 (A), CCL5 (B), CCL3 (C), TNFα (D) and IFNγ (E) were measured by ELISA (n = 6). Statistically significant differences are indicated by: **P < 0.01 when compared with control; ##P < 0.01 when compared with WT.

