
Figure 4.
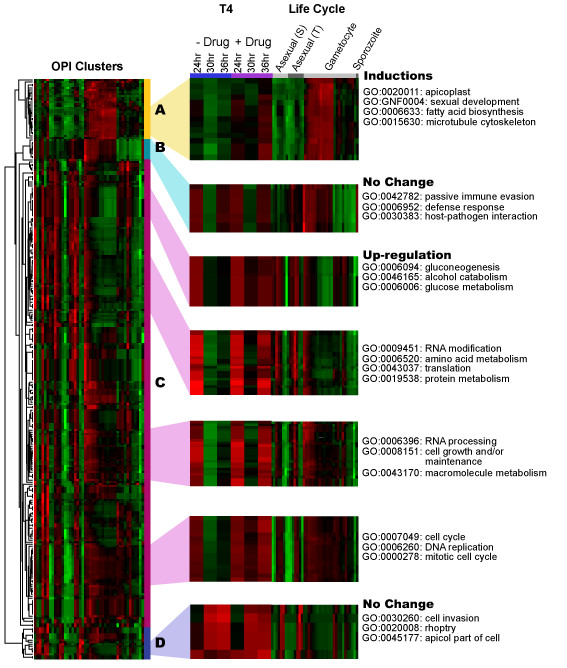
Hierarchical clustering of all 290 OPI clusters. Genes in each cluster share a similar expression pattern represented as a row in the heat map. The right panel is the zoom-in view of selected heat map sections with the six T4 data set further horizontally expanded for ease of visual inspection. Bright red indicates highest expression; bright green indicates lowest expression (gene-wise normalized). Asexual S, T refers to the erythrocytic cycle expression profile analysis of malaria parasite synchronized using Sorbitol chemical treatment (S) or the thermo-cycling incubation (T) describes in Le Roch et al, 2003. Gene behaviors of T4-treatment can be characterized into three categories: Pattern A shows an induction in gametocytogenesis; Pattern B and D shows no change in expression before and after T4 treatment; Pattern C shows an up regulation most likely due to DNA replication, metabolism and cell cycle progression. Some representative GO groups are shown next to the pattern.