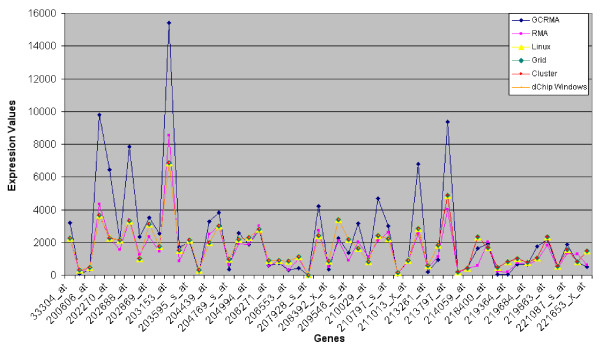
Figure 3.
Trend of (mean) expression values of experiment HUVEC arrays using R/Bioconductor and dChip algorithms. A graphical representation of results presented on Table 2 and 4 is shown. It's worth noting that all dChip versions results are overlapped and they have a similar trend compared to RMA algorithm.

