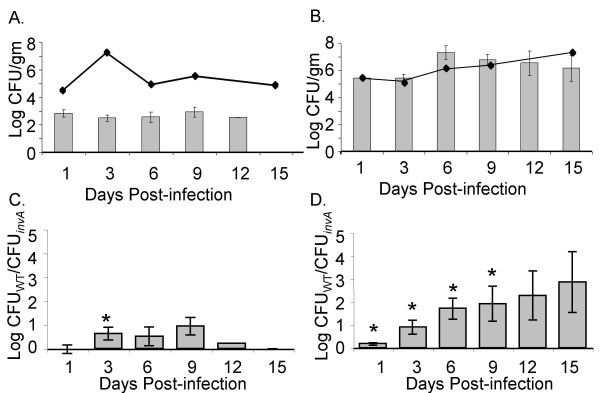
Figure 6.
Dynamics of S. Typhimurium fecal shedding in chicks and mice. Recovery of wild type ATCC14028 in the feces of chicks (A) and mice (B) is shown as mean log CFU/g of feces. Lines represent the level of cecal colonization of each animal model. Recovery of wild type and ΔinvA mutant in the feces of chicks (C) and mice (D) is shown as the mean log ratio of wild type versus mutant. Error bars indicate standard error, and asterisks indicate a significant difference relative to the ratio of wild type vs. mutant in the incoculum at P < 0.05.

