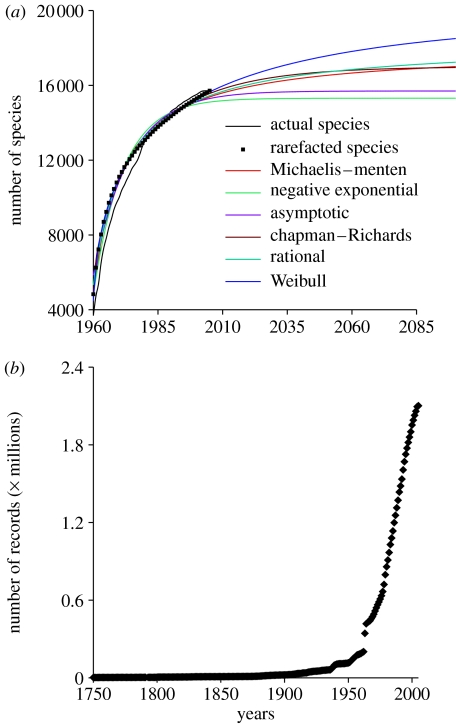
Figure 2.
Temporal description of marine fish species worldwide. (a) The species accumulation curve, the smoothed rarefaction curve and the fit of the nonlinear models to the global data. Results for the different models are shown in table 2. (b) The accumulation of records with date stamps in OBIS.

