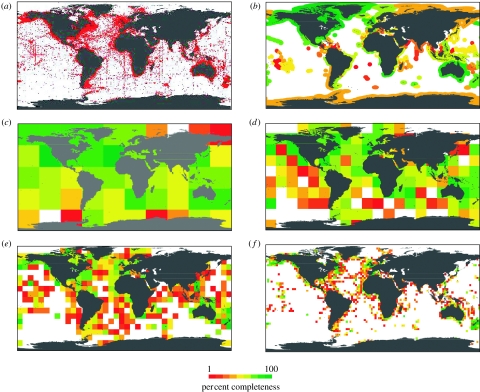
Figure 4.
Taxonomic sampling of the marine fishes of the world. (a) The positions of the approximately 2.1 million georeferenced records used in this study. (b) The completeness of the taxonomic inventories within the high seas and EEZs of the world. (c–f) Resolutions of 36°×36°, 18°×18°, 9°×9°, and 3°×3°, respectively. White areas in the maps indicate locations whose curves have less than 10 years sampled. Congruence between the number of species observed and expected was R2=0.0098, n=1318, p<0.3 (at 3°×3°); R2=0.00002, n=409, p<0.9 (at 9°×9°); R2=0.0001, n=151, p<0.87 (at 18°×18°); and R2=0.85, n=48, p<0.001 (at 36°×36°).

