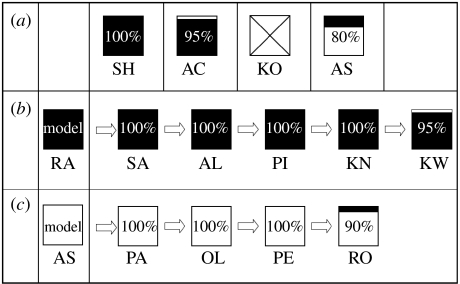
Figure 3.
(a–c) Diffusion chain results. Each box represents one subject's performance (black area, per cent lift actions; white area, per cent slide actions; crossed area, no action) for (a) control, (b) lift and (c) slide groups. Codes under each box identify the subject. Arrows indicate the progression in the diffusion chain; each subject followed by an arrow was the model for the next subject in the chain.

