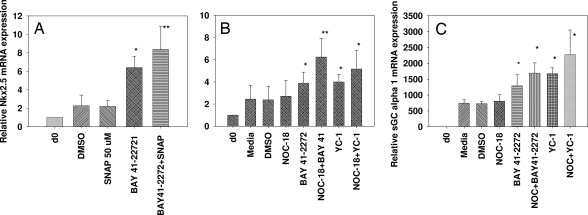
Fig. 4.
Effect of NO donors and sGC activators in H-9 cells. Partially differentiated cells were exposed to a single treatment of the NO donor SNAP (50 μM), BAY 41-2272 (5 μM), and the combination of SNAP+BAY41 (A) or multiple treatments of NOC-18 (1 μM), BAY 41-2272 (3 μM), or the combination of NOC-18+BAY41, YC-1 (3 μM) or the combination of NOC-18 + YC-1 (B and C). The samples were analyzed for Nkx2.5 (A and B) and sGC α1 transcript levels (C) by quantitative RT-PCR. Error bars indicate ± SEM. Significance using paired Student's t test is shown: *, P < 0.05; **, P < 0.01. n = 5–7.

