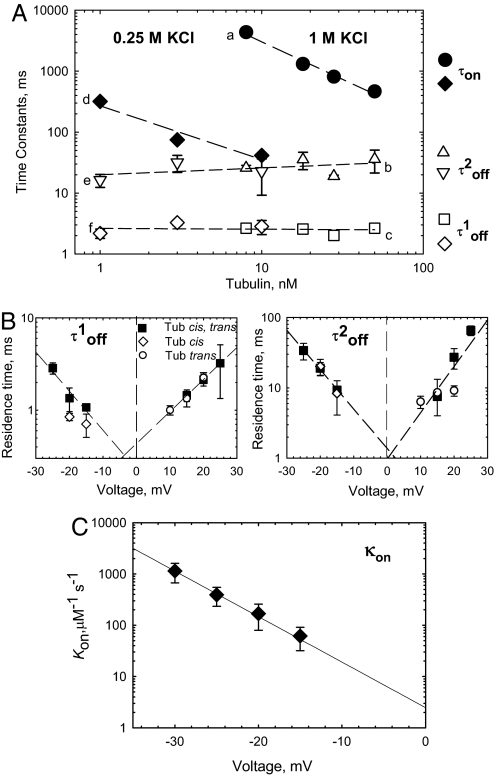
Fig. 2.
The binding parameters for tubulin-induced VDAC closure depend on tubulin concentration, electrolyte concentration, and applied voltage. (A) (a and d) VDAC open time between successive blockages, τon, linearly decreases with tubulin concentration and depends on salt concentration. The medium consisted of 1 M KCl (a, filled circles) and 0.25 M KCl (d, filled diamonds). Both components of tubulin residence (closed) time, τoff(1)and τoff(2), are independent of tubulin or salt concentration (b, c, e, and f, open symbols) and are equal to 2.8 ± 0.5 ms and 23.7 ± 6.3 ms, respectively. The applied voltage was −20 mV. (B) Voltage dependence of VDAC residence times, τoff(1) and τoff(2), in the presence of 50 nM tubulin in cis (open diamonds), trans (open circles), or both sides (filled squares) of the membrane. Residence time in extrapolation to 0 voltage does not depend on 1-side (cis or trans) or 2-side tubulin addition. (C) Voltage dependence of the on-rate, κon, with 50 nM tubulin added to the cis side. The line is an exponential fit to κon = κ0exp(nVF/RT) with n = 4.97. Each time value presents the characteristic time of 9 different log probability fitting procedures ± SE. The medium consisted of 1 M KCl (B and C) and buffered with 5 mM Hepes at pH 7.4. VDAC was isolated from N. crassa mitochondria. Bilayer membranes were formed from DPhPC.

