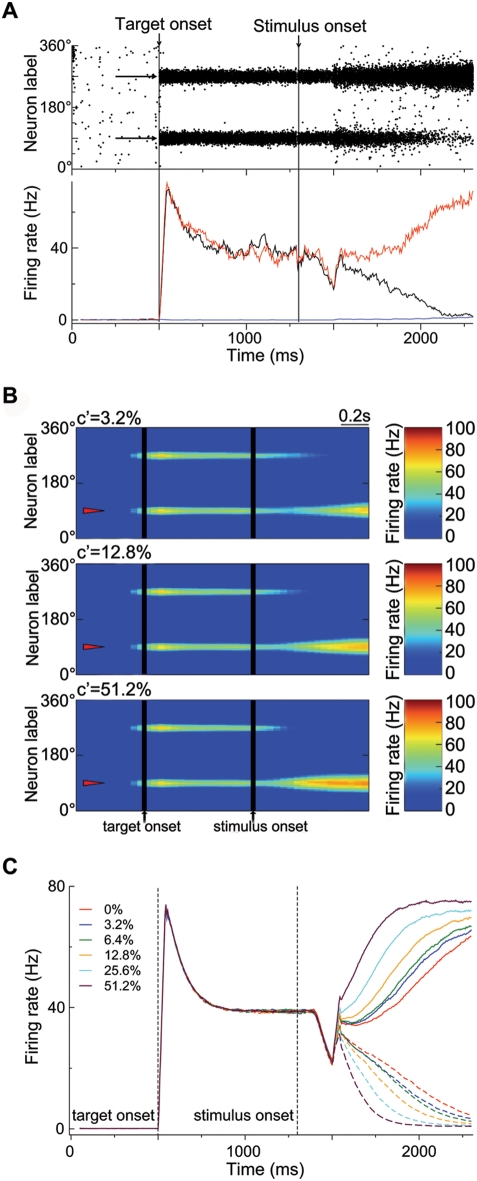
Figure 3. Network activity during the direction discrimination task.
(A) (Top) Spatiotemporal firing pattern of pyramidal cells with the stimulus at zero coherence. x-Axis, time; y-axis, cells labeled by their preferred directions. Two targets are separately presented at 90° and 270° (indicated by arrows). The targets and the motion stimulus are presented at 500 ms and 1,300 ms, respectively. But there is a latency (about 200 ms) for the visual signal to reach LIP. (Bottom) Time course of the population firing rates for the two neural pools, each consisting of 140 neurons and separately centered at 90° (r 1, black) and 270° (r 2, red), and for the neurons whose preferred directions are at least 26° away from 90° and 270° (blue), respectively. (B) Network activity patterns shown with a color-coded firing rate map for three coherence levels. The coherent motion direction is 90° (indicated by triangles). (C) Time course of population firing rates r 1 (solid curves) and r 2 (dashed curves), averaged over 1,000 correct trials, for various coherence levels. See Results for detailed description.

