
Figure 4. The network's performance and population activity during the direction discrimination task.
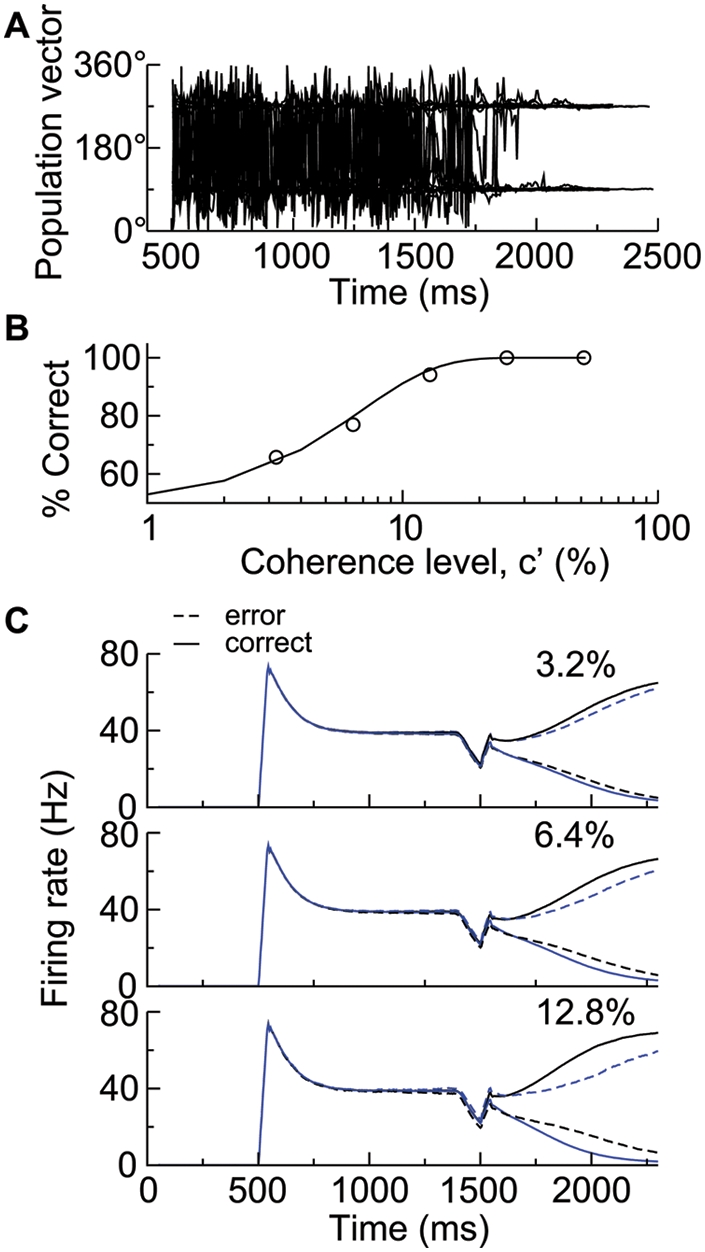
(A) Time course of population vector. Twenty traces are shown with the stimulus at zero coherence. (B) The probability of correct choices versus motion strength. Data (circle) are fitted by a Weibull function with α = 6.85% and β = 1.45 (solid curve). (C) Time course of population firing rates r 1 (black) and r 2 (blue), averaged over correct (solid curves) and error (dashed curves) trials, respectively, for three coherence levels.