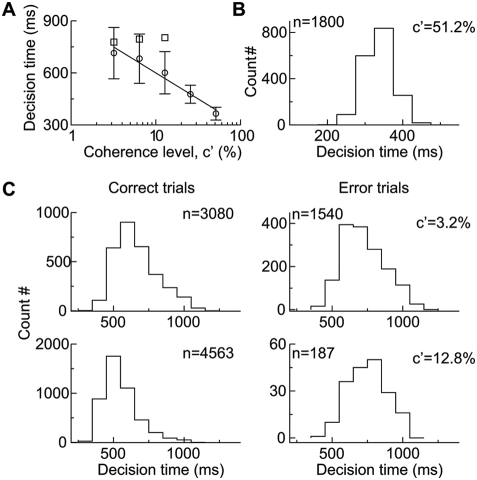
Figure 5. Decision time in the direction discrimination task.
(A) Mean decision time as a function of motion strength. The mean decision time on error trials (square) is longer than that on correct trials (circle). The solid line is a linear fit to the data (circle). Error bars indicate SD. (B) The decision time histogram for c′ = 51.2% with the binwidth of 50 ms. (C) The histograms of decision time (with the binwidth of 100 ms) on correct (left) and error (right) trials for c′ = 3.2% (top) and 12.8% (bottom), respectively. Decision times are more variable at lower coherence levels. The number of trials used for plotting the histograms are indicated in the panels.

