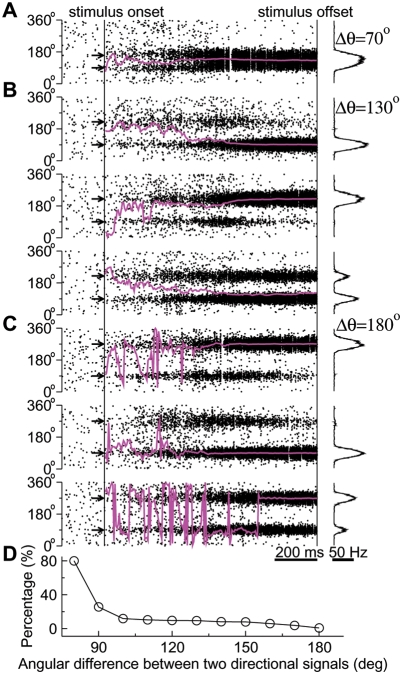
Figure 8. Distinct behavioral regimes during the probabilistic estimation of motion direction.
Network activity can be distinguished based on the difference between the stimulus and microstimulated directions, Δθ. Spatiotemporal firing pattern is superimposed by the time course of the population vector θ PV (magenta). The network activity profile at the stimulus offset is shown on the right. The microstimulated direction is always 90°, while the stimulus direction θ 1 varies with trials. (A) When Δθ is relatively small (θ 1 = 160°), direction estimates are based on vector averaging. (B) For an intermediate Δθ (θ 1 = 220°), the network exhibits winner-take-all on some trials (top and middle) and vector averaging on other trials (bottom). (C) For a large Δθ (θ 1 = 270°), network activity is predominated by the winner-take-all mechanism. (D) The percentage of trials on which the smaller of |θE−θ 1| and |θE−θ 2| (with θE being the direction estimate) is larger than 10° as a function of Δθ.

