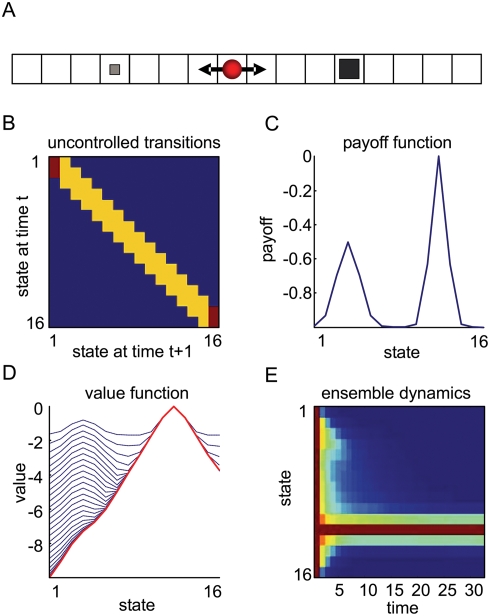
Figure 1. Toy example using a one-dimensional maze.
(A) The agent (red circle) moves to the adjacent states from any given state to reach a goal. There are two goals, where the agent obtains a small payoff (small square at state 4) or a big payoff (big square at state 12). (B) The uncontrolled state transition matrix. (C) The payoff-function over the states with a local and global maximum. (D) Iterative approximations to the optimal value-function. In early iterations, the value-function is relatively flat and shows a high value at the local maximum. With a sufficient number of iterations, τ≥24, the value-function converges to the optimum (the red line) which induces paths toward the global maximum at state 12. (E) The dynamics of an ensemble density, under the optimal value-function. The density is uniform on state-space at the beginning, t = 1, and develops a sharp peak at the global maximum over time.

