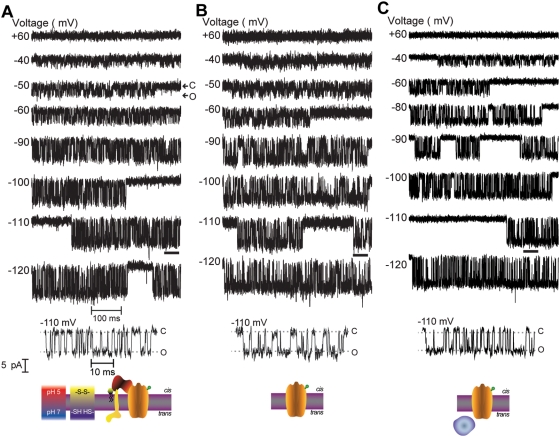
Figure 2. BoNT/A HC, TD, and LC-TD channel activity measured on excised patches of Neuro 2A cells.
Representative single-channel currents at the indicated voltages; consecutive voltage pulses applied to the same patch for each experimental condition. Channel opening is indicated by a downward deflection; C and O denote the closed and open states. γ values for HC (A) = 65.3±0.4 pS, TD (B) = 64.4±0.4 pS, and LC-TD (C) = 69.2±0.9 pS. The sections of the recordings obtained at −110 mV delimited by the black bars are shown in the bottom traces at a 10-fold higher time resolution; the prototypical square events which are characteristic of unitary channel currents are clearly discerned. An interpretation of the results is schematically illustrated at the bottom of each panel: The membrane is depicted as a grey bar with magenta boundaries; LC–purple, TD–orange, RBD–red, and the cysteine involved in the LC-HC disulfide crosslink–green sphere; the SV2 protein-receptor is illustrated in yellow and the GT1b co-receptor in black (ceramide moiety inserted in the bilayer) and lime (the polar head group); the pH and redox conditions on the cis and trans compartments are indicated. These conventions also hold for Figure 4.

