
FIGURE 10. Heparin inhibition of histone H3 acetylation in pulmonary fibroblasts.
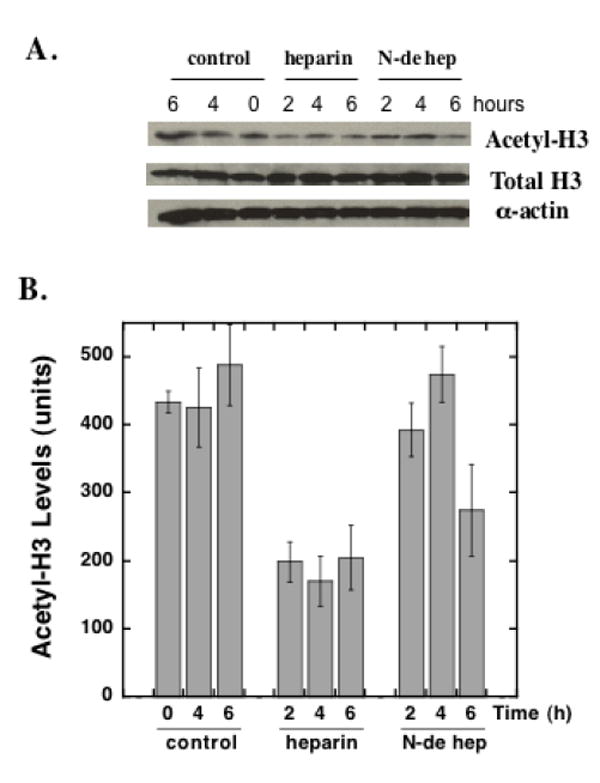
Pulmonary fibroblasts were treated with heparin (50 μg/ml) or N-desulfated-heparin (50 μg/ml) or nothing (control) for 2, 4 or 6 hours. Cells extracts were subjected to immunoblot analysis for total histone H3, acetylated histone H3 and alpha actin. Panel A shows representative immunoblots of acetylated histone H3 (top row), total histone H3 (middle row), and alpha actin (bottom row). Panel B is a bar graph representation of the average relative density measurements of the acetyl-H3 bands from four separate samples ±SD at each time point (N-de hep = N-desulfated heparin). ANOVA followed by the Newman-Kleus multi-comparison t-test revealed significant differences between the heparin treated and control samples at all time points, significant differences between heparin and N-desulfated heparin at the 2 h and 4 h time points, and significant differences between the N-desulfated heparin treated and control samples at the 6 h time point. There were no significant differences observed between the control groups at the three time points. Similar results were observed in three separate experiments with cells from different primary isolations.