
Table 1.
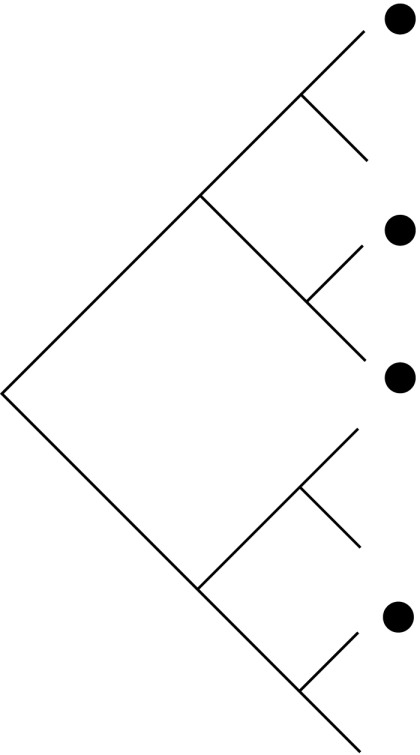
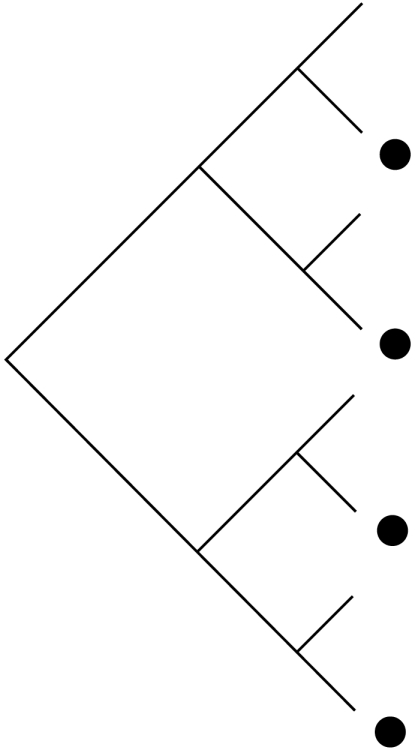
Schematic demonstrating how habitat filtering and competition affect patterns in the distribution of community members across phylogenies (black dots), species-to-genus ratios and the phylogenetic structure of communities. NRI, net relatedness index; NTI, nearest taxon index.
| process | habitat filtering: species share traits that allow them to exist in a particular environment | random: neither process strongly effects community assembly nor multiple factors working in opposing directions | competition: only species that are not too ecologically similar are able to coexist |
| traits | conserved: if traits are convergent the patterns are similar to those shown for competition | either conserved or convergent | conserved: if traits are convergent the patterns are similar to those shown for random communities |
| distribution of community species on phylogeny | 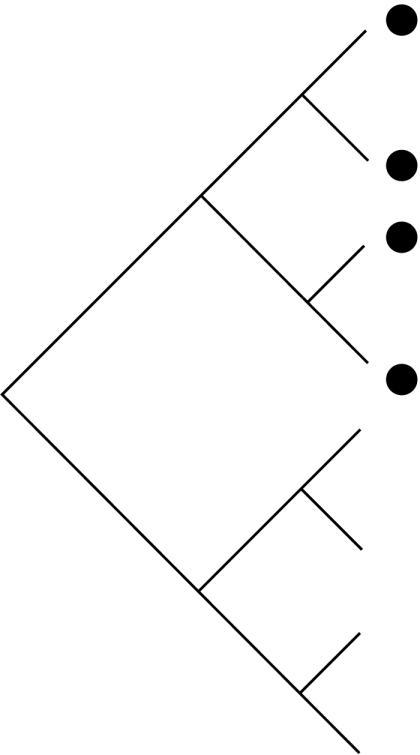 |
 |
 |
| species : genus ratio | more species per genus than expected by chance | no more or less species per genus than expected by chance | fewer species per genus than expected by chance |
| phylogenetic structure | phylogenetic clustering (positive NRI and NTI scores) | random phylogenetic structure (NRI and NTI scores not significantly different from zero) | phylogenetic overdispersion (negative NRI and NTI scores) |