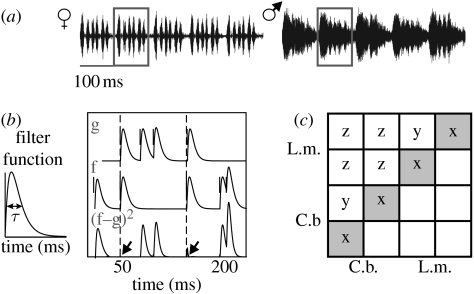
Figure 2.
Acoustic stimuli and principle of spike train metric. (a) Song of a C. biguttulus female and male; one syllable is marked in each song. (b) Principle of the spike train metric analysis according to van Rossum (2001); see text. (c) Scheme for the intra- and interspecific comparison of spike trains of two neurons in each of both species. The shaded squares along the diagonal, denoted with ‘x’, contain the distance values between the 8 and 10 spike trains obtained from a single cell, and represent a measure for the trial-to-trial variability of single neurons. The ‘y’ squares represent the dissimilarities obtained when comparing different specimens of a particular neuron type recorded in a given species, while the ‘z’ squares denote the spike train dissimilarities between the two species.

