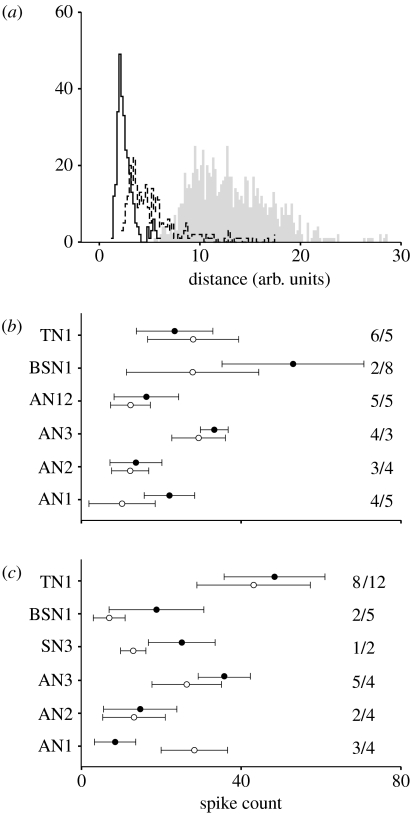
Figure 4.
Influence of spike rate on the metric data. (a) Comparison of distance distributions for six specimens of the TN1 neuron in the locust that exhibited very different spike rates (low count sample, 35±8 Hz; high count sample, 100±20 Hz; mean±s.d.). Stimulus was the female song pattern, while in figure 3a the stimulus was the male song. Solid line, low spike-count data; dashed line, high spike-count data; grey area, comparison of the low- and high-rate ‘inter’ data. Note the shift in the grey distribution to higher distances. Spike rates of our samples for (b) male and (c) female songs as stimuli. Filled circles, data of C. biguttulus; open circles, data of L. migratoria (mean±s.d., based on single spike trains). The number of recorded cells in both species indicated in figures (N/M, C.b. first). On the x-axis, the spike counts in the 500 ms evaluation window are shown. Note that the differences in spike count between (b,c) are mainly due to differences in stimulus structure (figure 2a).

