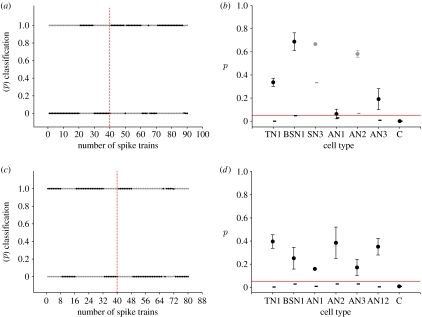
Figure 6.
Information-based clustering. The assignment probabilities of AN3 spike trains stimulated with a (a) female song and of AN12 spike trains tested with a (c) male song. The two classes are indicated with grey (cluster 1) and black (cluster 2) dots, one for each spike train. On the x-axis, the number of spike trains is shown. Tick intervals indicate single specimens. The difference in tick intervals between (a,c) is due to different numbers of stimulus repetitions (10 and 8 repetitions, respectively). Vertical dashed red lines indicate the border between the two species, L. migratoria spike trains and the C. biguttulus, respectively, on the left hand side and right hand side (b,d) Mean p values (black circles) and standard deviation for all tested cells types as stemming from the female or male song. The achievable significance levels are indicated with short horizontal bars for each cell type. Control calculations for TN1 and BSN1 cells or AN3 and AN12 cells, respectively. Horizontal red lines, 0.05 significance level.

