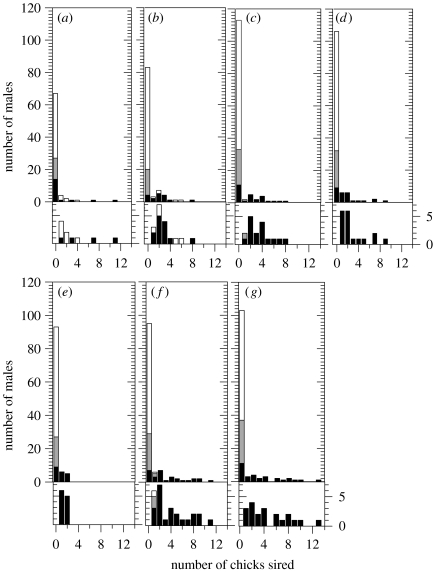
Figure 2.
(a–g) Yearly distribution of reproductive success among adult males of different social status. Alpha males are represented by black bars, betas by light grey and adult males that were neither alpha nor beta by white bars. Lower histogram for each year shows an expanded view of males with non-zero reproductive success. (a) 2000, (b) 2001, (c) 2002, (d) 2003, (e) 2004, (f) 2005 and (g) 2006.

