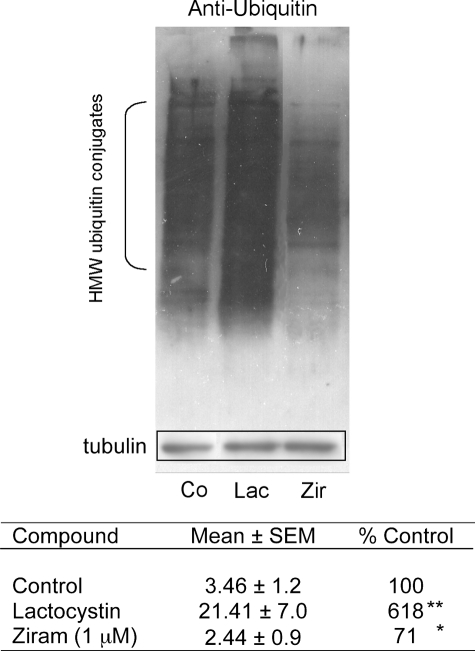
FIGURE 5.
Anti-ubiquitin Western blot analysis of lysates from cells following treatment with 5 μm lactacystin, 0. 1 μm rotenone, or 1 μm ziram. The relative densities were determined using the NIH Image program, normalized to tubulin immuoreactivity in the same blot, and expressed as percentages of untreated controls (n = 4). 20 S inhibition using lactacystin resulted in an increase in high molecular weight ubiquitin conjugates, whereas ziram treatment reduced them. **, p ≤ 0.01; *, p ≤ 0.05.

