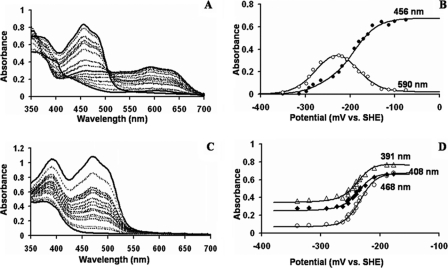
FIGURE 3.
A, spectral titration of wild-type nNOS FMN domain. B, absorbance versus potential plots of wild-type nNOS FMN domain at 456 and 590 nm. At 456 nm, there is maximal change in the flavin absorbance from the fully oxidized to fully reduced forms. At 590 nm, the formation and decay of the blue FMN semiquinone is monitored. C, spectral titration of the ΔG810 mutant FMN domain. D, absorbance versus potential plots of ΔG810 mutant FMN domain at 391, 408, and 468 nm. At 468 nm, the absorbance of the oxidized FMN is maximum. At 391 nm, the FMN semiquinone shows a maximum, whereas 408 nm is the approximate isosbestic point for the FMN oxidized/semiquinone maximum. The data points from all these titrations are fit to the two-electron modified Nernst equation (Equation 1) as given under “Experimental Procedures.” Spectral behavior was completely reversible during oxidative and reductive titrations.

