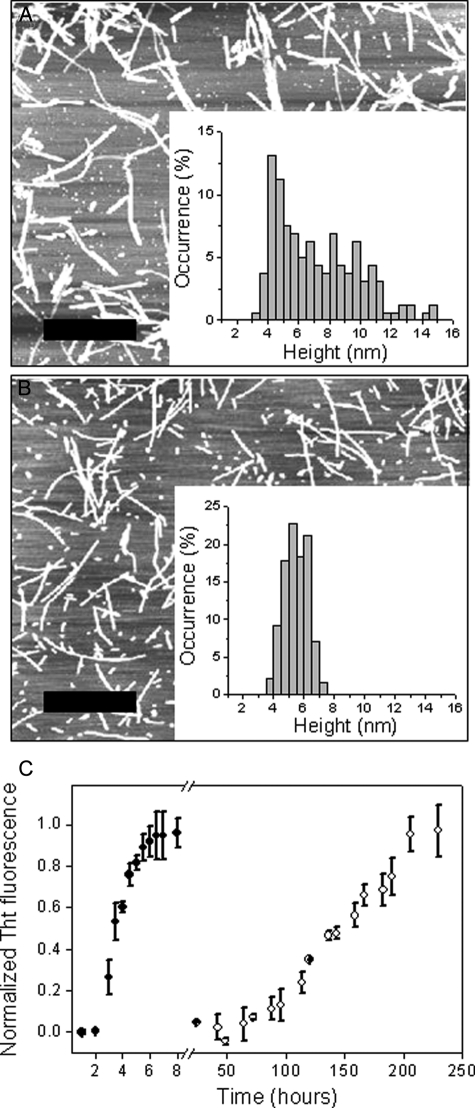
FIGURE 1.
Fibrillization of D178N huPrP90-231. Atomic force microscopy images of amyloid fibrils were formed under denaturing conditions (2 m GdnHCl in 50 mm phosphate buffer, pH 7) (A) and from the native-like precursor (50 mm acetate buffer, pH 4) (B). The scale bar corresponds to 1 μm. Insets show histograms of fibril height distribution. C, time course of D178N huPrP90-231 (30 μm) amyloid fibril formation under denaturing (•) and native-like (○) conditions. Data are expressed as a fraction of maximal ThT fluorescence. Note the break in the x axis.

