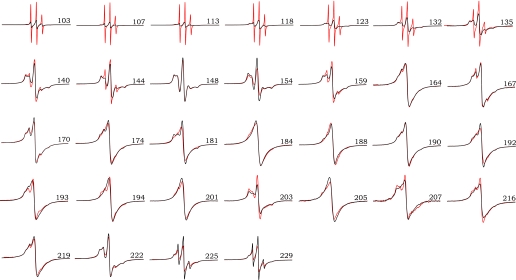
FIGURE 2.
EPR spectra for D178N huPrP90-231 fibrils formed under native-like and denaturing conditions. The sites of spin labeling are indicated by the residue number for each pair of spectra. EPR signals for amyloid fibrils formed under denaturing conditions (rPrPAmU) are shown in black, and fibrils grown under native-like conditions (rPrPAmN) are shown in red. Scan width is 200 G, and spectral pairs for each position are scaled to the same number of spins.

