FIGURE 3.
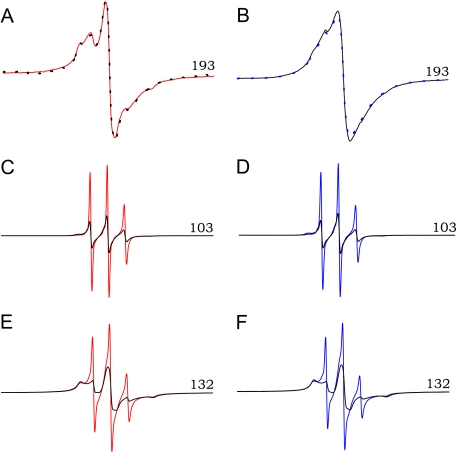
Region-specific effects of pH on the structure of rPrP amyloid. A, EPR spectrum of rPrPAmN fibrils (grown in 50 mm acetate buffer, pH 4) labeled at a representative β-core position (residue 193) is shown in red. Fibrils were then re-equilibrated for 30 min in 50 mm phosphate, pH 7, and the EPR signal was measured again (black dotted line). B, an analogous procedure was applied to residue 193-labeled rPrPAmU fibrils (grown in 50 mm phosphate buffer, pH 7, plus 2 m GdnHCl) equilibrated in 50 mm phosphate, pH 7 (black line), and subsequently re-equilibrated in 50 mm acetate, pH 4 (blue dotted line). C and E, EPR spectra of rPrPAmN fibrils labeled at the indicated N-terminal positions. Fibrils were grown and equilibrated at pH 4 (red line) and subsequently re-equilibrated at pH 7 (black line). D and F, EPR spectra of rPrPAmU fibrils labeled at the same N-terminal positions and equilibrated at pH 7 (black line) and subsequently re-equilibrated at pH 4 (blue line). All experiments were performed using D178N huPrP90-231.

