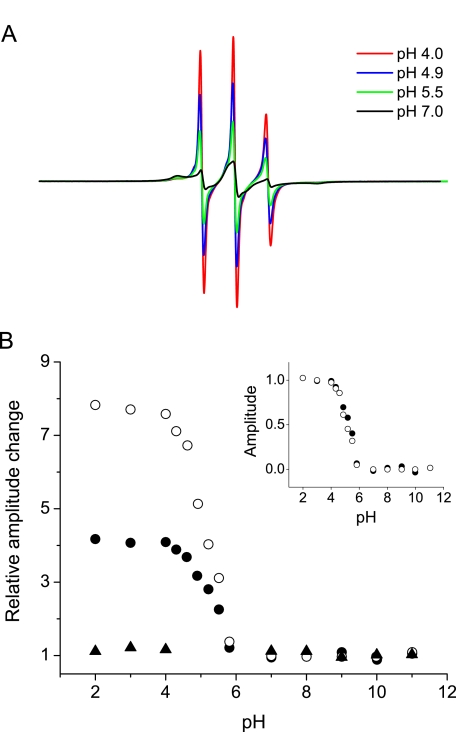
FIGURE 4.
pH-induced structural transition in the N-terminal region of rPrP amyloid. A, EPR spectra from a representative pH titration for rPrPAmU fibrils labeled at position 113. Amyloid fibrils were initially equilibrated in 50 mm phosphate, pH 7 (black line), and then resuspended in decreasing pH buffers. B, plot of EPR signal central line amplitude versus pH for rPrPAmU fibrils labeled at positions 103 (•), 113 (○), and 192 (▴). Data are expressed as the relative increase in signal amplitude relative to that at pH 7. Inset, titration data for residues 103 and 113 replotted as the fractional change in signal amplitude relative to spectra obtained at pH 7. All experiments were performed using D178N huPrP90-231.

