Fig. 5.

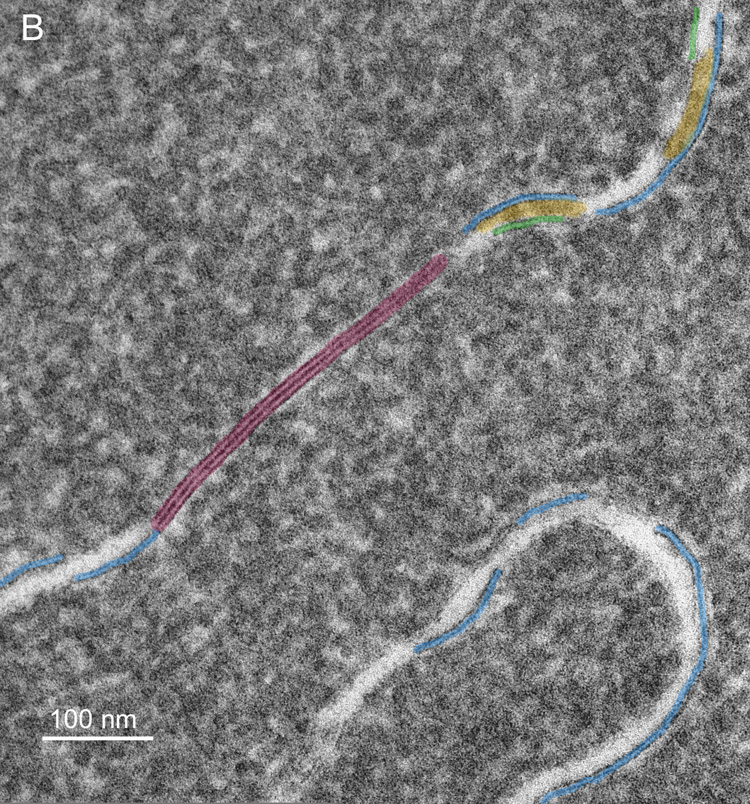
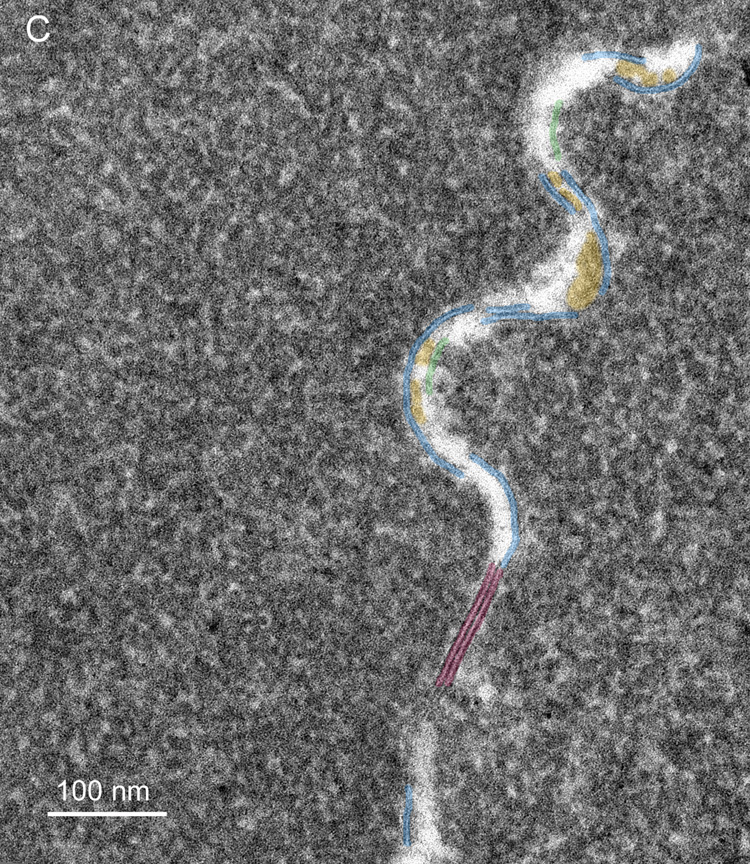
High magnification TEM images reveal membrane details in advanced nuclear cataracts. A. Individual membranes have a trilamellar profile (blue arrowheads) and junctions are pentalamellar (red arrows). The ultrastructural data indicate that bilayer membranes are lost, extracellular space (ECS) enlarges and protein-like deposits (yellow) appear, often on curved membranes containing AQP0 (blue arrowheads) (55 years old). B. Similar membrane pattern from a different advanced nuclear cataract (56 years old). Membranes and junctions are color coded as gap junctions (red lines) and aquaporin 0 containing membranes (blue lines), which predominate probably because they are the most stable. The lipid-rich bilayers (green lines) define the ECS where protein-like deposits (yellow) are frequently observed. C. High magnification TEM image of membranes from a transparent donor lens (48 years old). Membranes are colorized as in Fig. 5B. Notice that the membranes are similar and the cytoplasm is more homogeneous compared to images of the cataracts.


