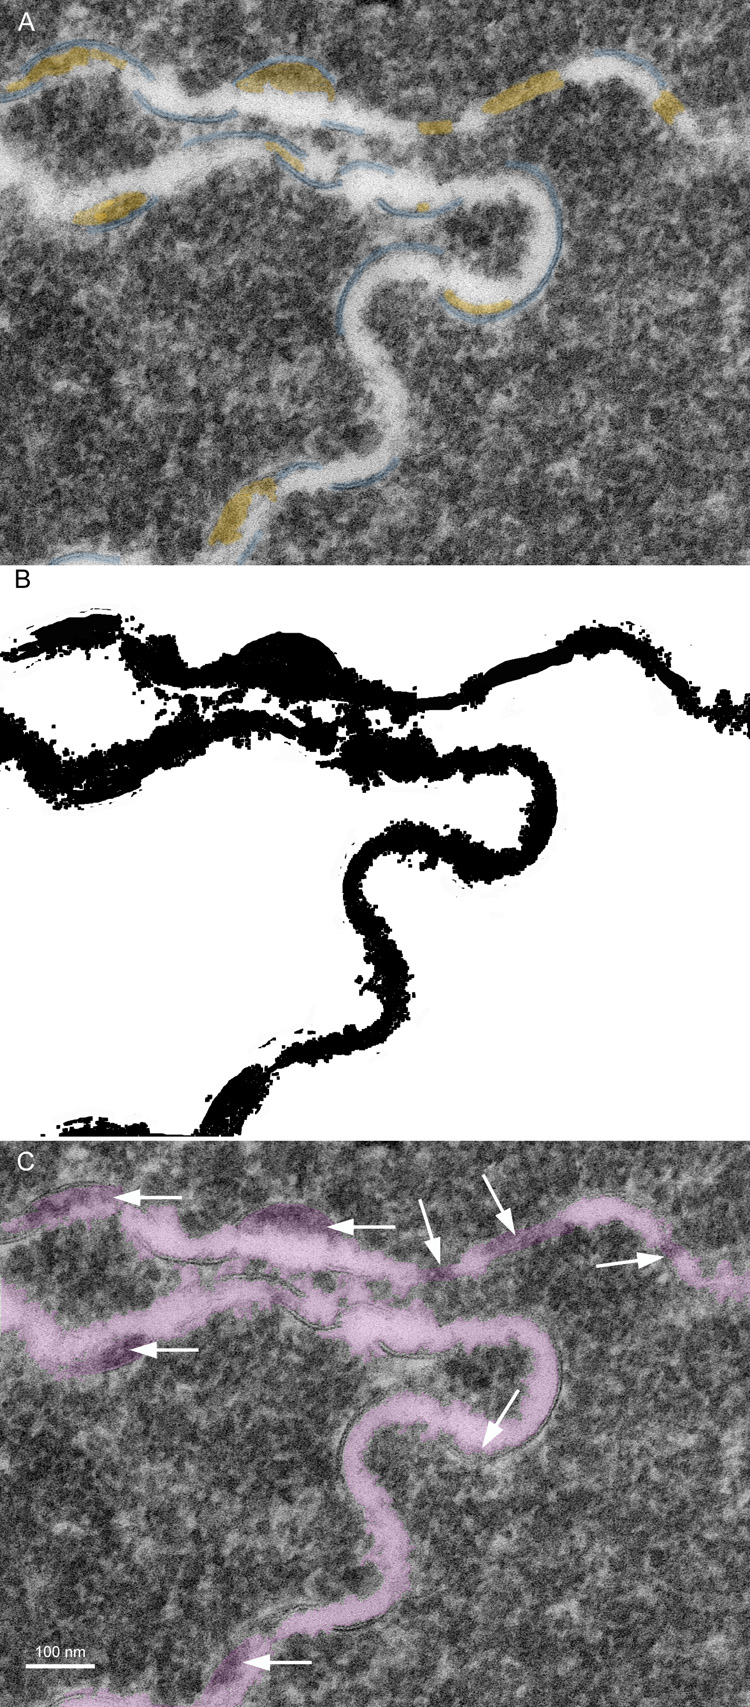
Fig. 9.
Morphometric analysis to determine the average thickness of the ECS. A. TEM image of a cataract showing well-defined membranes (blue) and ECS deposits (yellow) (51 years old). B. ECS after automatic threshold processing, inverting and manual removal of non-ECS pixels. The total number of ECS pixels was equivalent to about 120,000 nm2 and the length of the ECS measured about 2800 nm. Therefore, the average thickness of the ECS for this example was about 42 nm. C. Overlay of images, with the threshold derived ECS colored and at 20% transparency, indicating the close correspondence of processed and original ECS. The ECS deposits appear darker and are easy to locate (arrows).

