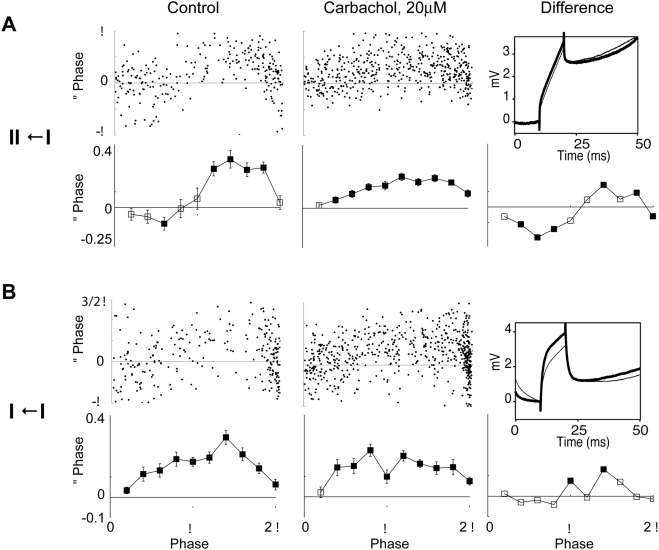
Figure 2. Change of PRCs due to cholinergic neuromodulation in single neurons.
Left column: control conditions. Center column: bath application of carbachol. Right column: difference between the charbachol and control conditions. Top plots: raw data. Bottom plots: mean±s.e.m. of binned data. Filled symbols: significant changes in comparison to the ISIs without a perturbation. Data from example neurons (A) showing a transition from a type II to a type I PRC and (B) remaining with a type I PRC. Insets: voltage averages of the perturbing pulses in the absence (thin line) and presence (thick line) of carbachol. Average amplitudes were (A) 3.2/3.5 mV (54/60 sweeps) and (B) 3.2/3.8 mV (67/67 sweeps).

