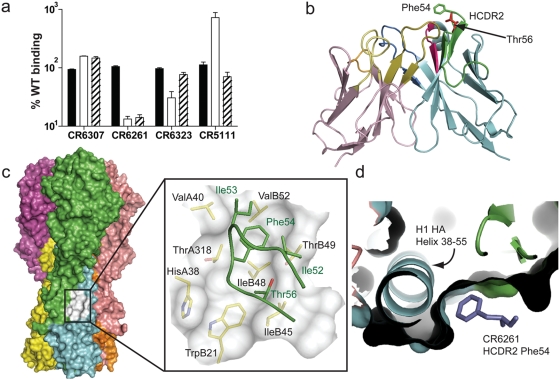
Figure 6. Identification of the antigenic region of neutralizing mAbs.
(a) FACS binding of IgG1 to surface expressed H5 rHA was measured after sequential treatment with trypsin (solid bars), pH 4.9 buffered medium (open bars) and DTT (striped bars) and expressed as percentage binding to untreated rHA from two independent experiments (mean±s.e.m.). (b) Global view of CR6261, VL is rose, VH is blue, HCDR2 is green, Thr56 red and Phe54 green. (c) Surface representation of trimeric H1 HA (A/South Carolina/1/18; 1RUZ). HA1 subunits are green, burgundy and pink, HA2 subunits yellow, blue and orange. The hydrophobic pocket is white and shown magnified as an inset with the HCDR2 of CR6261 in green docked to the structure. HA residues around and forming the hydrophobic pocket are labelled in black and HCDR2 residues in the pocket are green. (d) perpendicular view of the hydrophobic pocket down the axis of helix 38–55 occupied by Phe54 of HCDR2 in purple.

