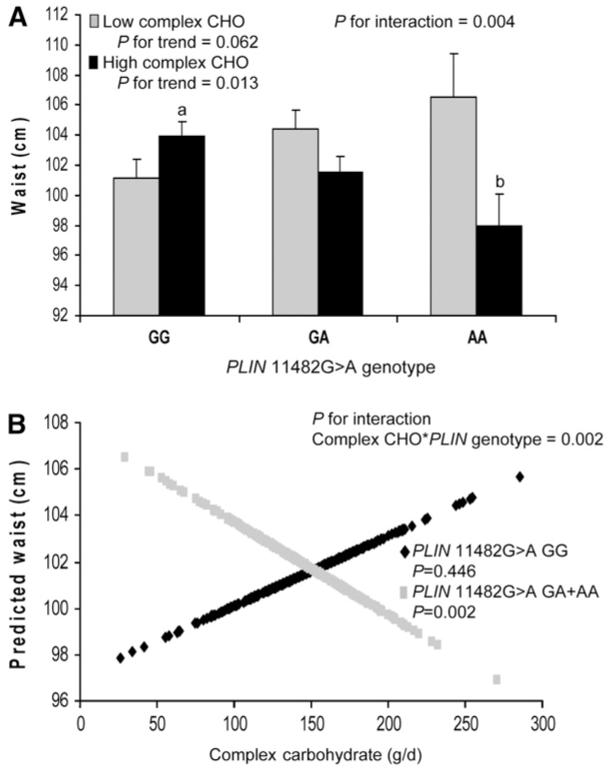
FIGURE 1.

Waist circumference (A) by PLIN 11482G > A genotype and complex carbohydrate intake, adjusted for total energy intake using the residuals method. High complex carbohydrate ≥144 g/d. Low complex carbohydrate <144 g/d. Values are means + SE. Means were adjusted for age, sex, smoking, alcohol, physical activity, diabetes medications, saturated fat, dietary fiber, and simple sugars. P-values for trend were obtained through comparisons of means for genotype (GG, n = 480; GA, n = 353; AA, n = 71) according to complex carbohydrate intake. P for interaction was obtained for the interaction between genotype and complex carbohydrate intake. Means marked with different letters differ, P < 0.05. Predicted values of waist (B) by PLIN 11482G > A genotype (GG, n = 480; GA+AA, n = 424) plotted against complex carbohydrate intake (g/d, adjusted for total energy using residuals method) as a continuous variable. Predicted values for waist were calculated from the regression model after adjustment for age, sex, smoking, alcohol, physical activity, diabetes medications, saturated fat, and simple sugars. P-value for interaction indicates the significance of the interaction term for complex carbohydrate and PLIN genotype in the adjusted regression model. P-values for GG and GG+AA indicate the significance of the regression coefficients in the adjusted regression model.
