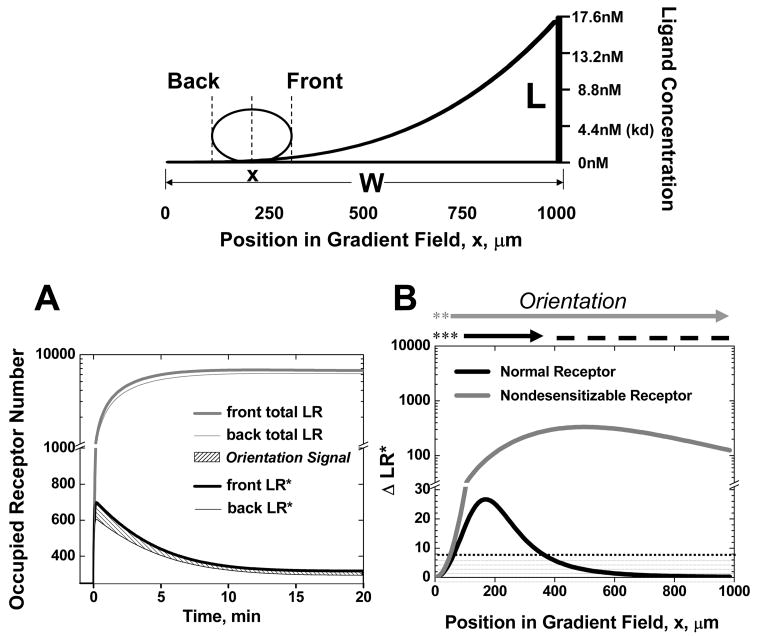
Figure 1. Chemotactic Orientation in a Gradients of a Single Ligand: (Top panel).
Illustration of a model cell in a single ligand gradient. (A) Total ligand-occupied receptor numbers (i.e. total LR = LR* + LRd) and active (signaling) receptor-ligand complexes (i.e. active LR*) in the front and back of a cell at the positions indicated as a function of time after ligand stimulation. Orientation is determined by the difference in active LR* across the cell length (shaded region). (B) Comparison of orientation of a cell expressing normal or nondesensitizable receptors in a single ligand gradient at the equilibrium state. The threshold of ΔLR* for orientation is set to 10 (shaded region). Dashed lines indicate the predicted stable regions of random migration (where ΔLR* is below the threshold and the cell will be drawn back if it migrates into the surrounding orienting regions). Asterisks indicate an unstable region of poor orientation (ΔLR* is below the threshold but the cell will be directed away from these zones if it migrates into the orienting region).

