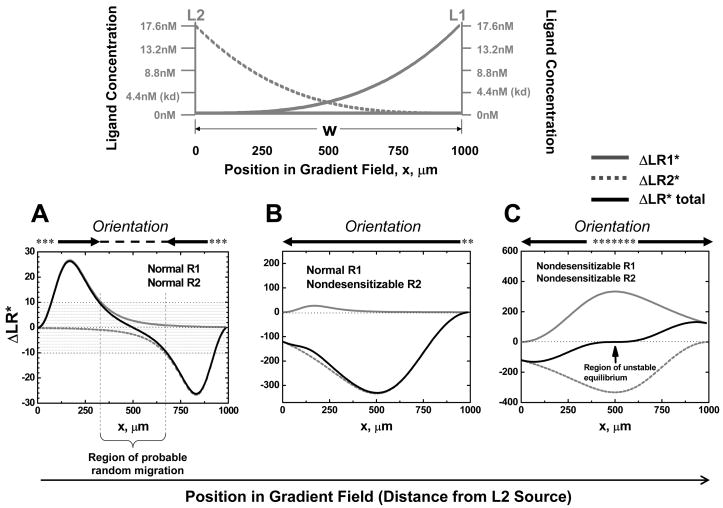
Figure 2. Chemotactic Orientation in Competing Ligand Gradients Predicted by the Model: Top panel.
Illustration of competing ligand gradients. Lower panels: Equilibrium orientation signals for cells expressing the indicated receptor types (normal/desensitizable or nondesensitizable) in competing gradients of L1 and L2. In each case, ΔLR1* to L1 gradient, ΔLR2* to L2 gradient, and ΔLR*total at equilibrium are compared as a function of position. The shaded area indicates ΔLR*total levels below the threshold for orientation, set at ±10. Above each plot is a summary of predicted cell orientation and positioning at equilibrium: Arrows indicate the orienting zones (where ΔLR*total is above the threshold). Dashed lines indicate predicted target zones, stable regions of random migration (where ΔLR*total is below the threshold and the cell will be drawn back if it migrates into the surrounding orienting regions). Asterisks indicate an unstable region of poor orientation (ΔLR*total is below the threshold but the cell will be directed away from these zones if it migrates into the orienting region). (A) Equilibrium orientation of a cell expressing normal receptors to L1 and L2 (normal R1 and R2). ΔLR*total is below the threshold for effective orientation within the parenthesis. (B) Equilibrium orientation of a cell expressing normal R1 and nondesensitizable R2 receptors. (C) Equilibrium orientation of a cell expressing nondesensitizable receptors to both L1 and L2 (nondesensitizable R1 and R2). The arrow indicates the unstable central position at which cells expressing nondesensitizable receptors experience no net orientation signal.

