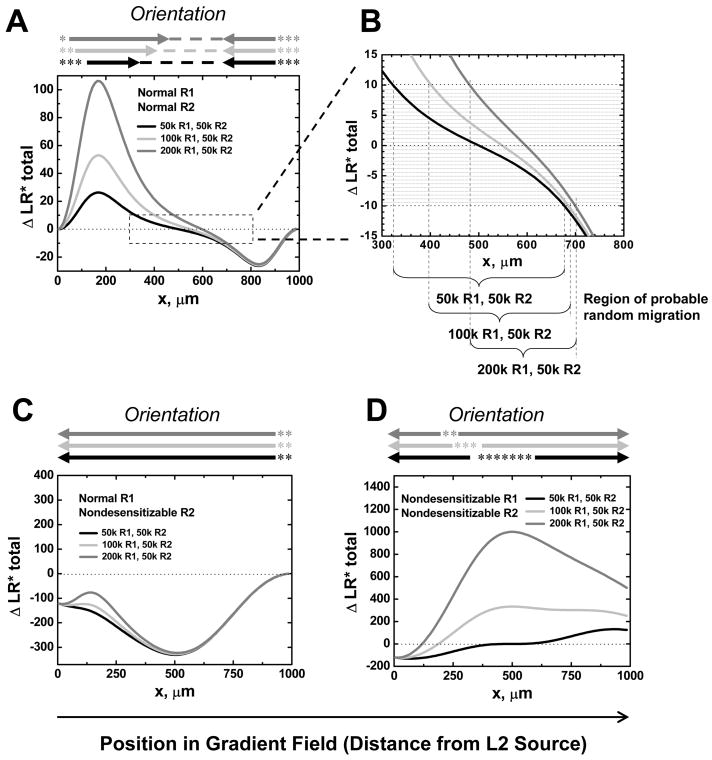
Figure 4. Effect of Receptor Numbers on Cell Positioning in Competing Gradients.
Equilibrium orientation signals for cells expressing the indicated receptor types and numbers in competing gradients of L1 and L2 configured as in Figure 2. ΔLR*total at equilibrium are compared as a function of position. The shaded area in B highlights ΔLR*total levels below the threshold for orientation, set at ±10. (A) The cell is allowed to express 2 or 4 times more desensitizable surface receptors R1 to L1 than desensitizable receptors to L2 (normal R1 and R2; R1=2R2 or R1=4R2. R2 is fixed at 50,000). In competing gradients, the equilibrium position shifts significantly toward the L1 gradient, for which the cell expresses more receptors. (B) Enlarged view comprising the target zone where the signals from the two agonists are balanced, resulting in no net orientation (ΔLR*total < threshold). The target zone (i.e. the region of probable random migration, indicated by parentheses) shifts toward L1 when R1 level increases. (C) If R2 is nondesensitizable, changes in R1 levels have no effect on orientation. (D) If both receptors are nondesensitizable, receptors numbers dramatically shift the position of unstable equilibrium of signals, but cells are predicted to migrate to one agonist source or the other. Same as in Figure 2, orientation (arrows), target zones (dashed lines), and zones of unstable random migration (asterisks) are summarized above the plot, and highlight the differences in predicted cell behaviors induced by wild type versus nondesensitizable receptors.

