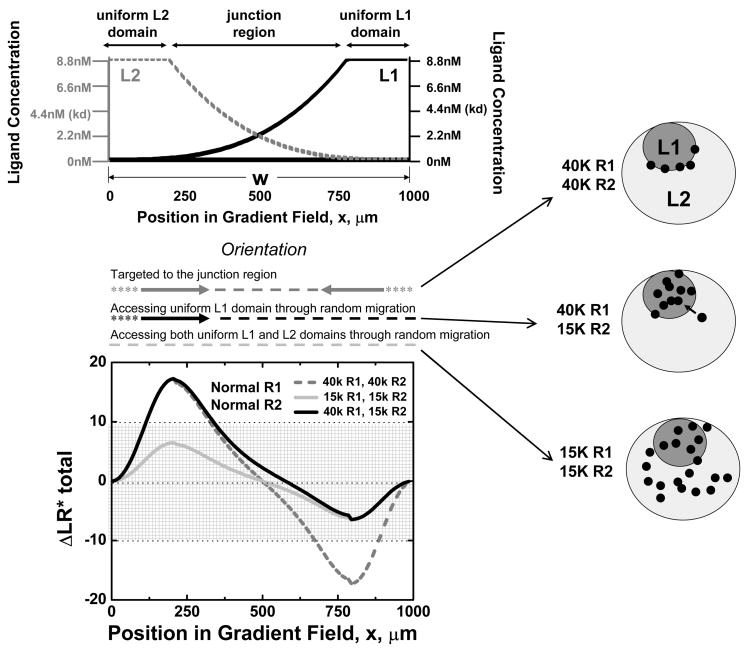
Figure 5. Effect of Receptor Numbers on Cell Access to Different Ligand Domains: (Top panel).
Illustration of adjacent uniform chemoattractant fields (domains) separated by a junctional region of overlapping gradients. (Bottom panel; and see schematics) When the cell expresses 40,000 wild type receptors of both R1 and R2, orientation (ΔLR*total) signals are predicted to target it to the junctional region. If R1 and R2 are reduced to 15,000, the orientation of the cell is below the threshold at all positions and thus the cell will have random access to both uniform L1 domain and uniform L2 domain and the junctional region. If only one receptor (R2 illustrated here) is reduced to 15,000 and R1 remains at 40,000, then a cell wandering into the junctional region will be preferentially directed towards uniform L1 domain; at long time points therefore cells will be restricted to the L1 domain. As for earlier figures, orientation (arrows), target zones (dashed lines), and zones of unstable random migration (asterisks) are indicated above the plot, and summarize the ability of modest changes in receptor numbers to control cell positioning and access to attractant-field defined microenvironmental domains. The schematics illustrate the predicted differential targeting in the context of two adjacent chemoattractant-defined domains as a function of receptor expression levels.

