
Figure 4. Analysis of a novel motif.
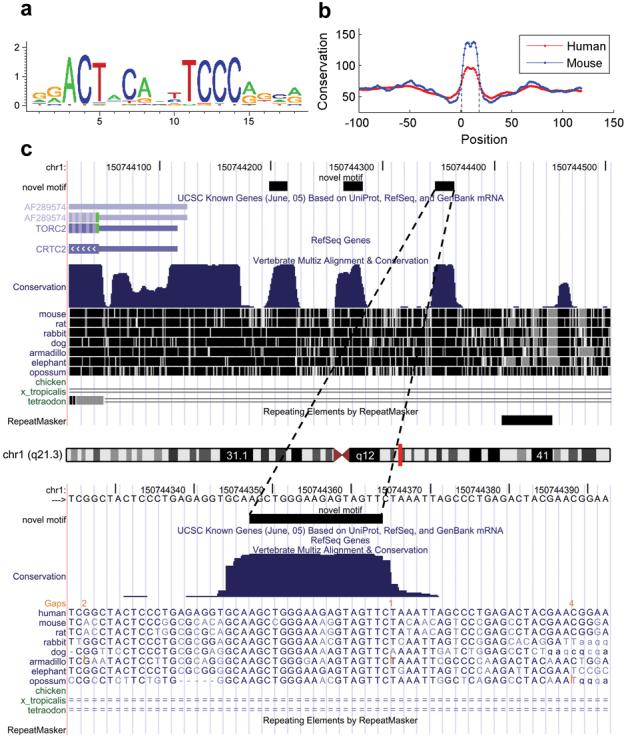
(a) Sequence logo of the motif visualized using CisGenome browser.
(b) Mean phastCons scores for the motif and flanking positions were extracted using CisGenome (Supplementary Fig. 12d). The score drops sharply at the motif boundaries which are indicated by two dotted vertical lines.
(c) A typical example of clustered motif sites. Sites are indicated by the black blocks in the novel motif track. They coincide well with conserved genomic elements. The example is shown using UCSC genome browser to illustrate that CisGenome allows users to link to external web resources (Supplementary Fig. 12c).