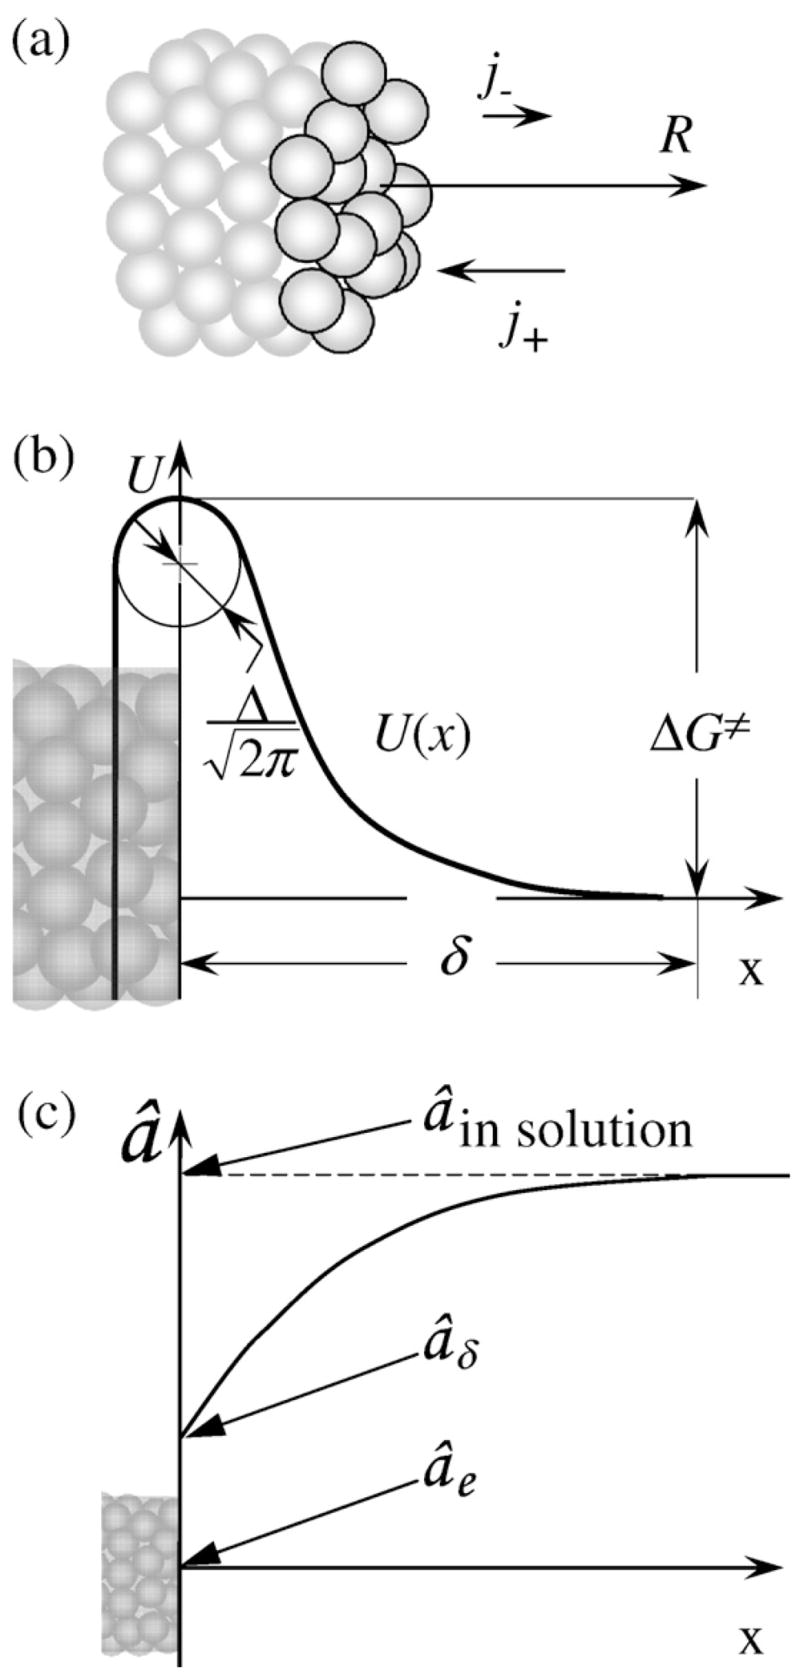
Fig. 2.

(a) Schematic representation of a growing fiber. HbS molecules at the growing edge are highlighted. (b) Schematic illustration of the free-energy relief U(x) in front of the growing fiber; for the meaning of the symbols, see the text. Growth rate R, incoming flux j+, and departing flux j− of molecules in (a) and x-axis in (b) are directed along the fiber axis (c). Schematic representation of the distribution of HbS activity in front of a growing HbS polymer fiber. The x-scale in (c) is much coarser than that in (b).
