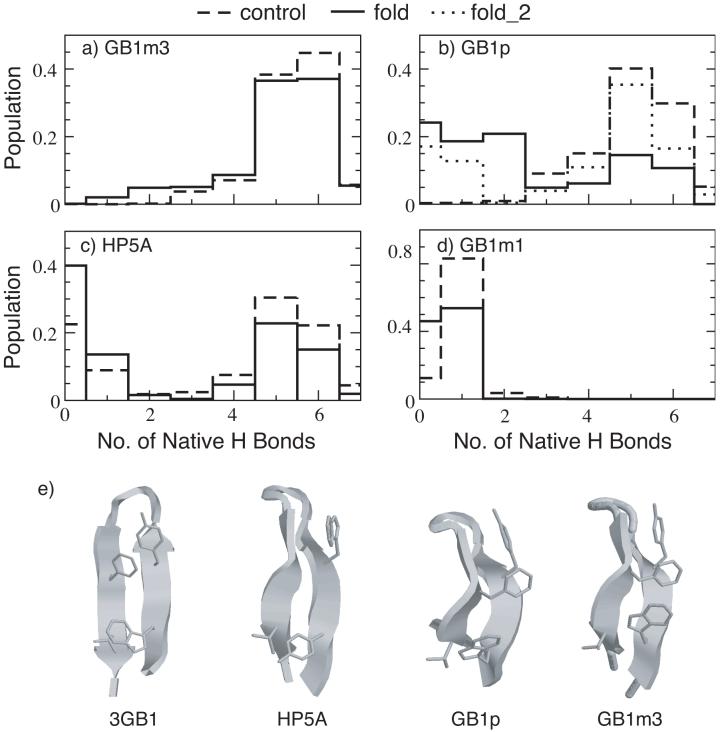
Figure 5.
Probability distributions of the number of native hydrogen bonds for (a) GB1m3, (b) GB1p, (c) HP5A and (d) GB1m3 at 270 K, and (e) representative folded hairpin structures of HP5A, GB1p and GB1m3 in comparison with the experimental fragment structure (PDB ID: 3gb1). The distributions were computed from the last 10 ns of REX-MD simulations of 30 to 50 ns in total length. The hydrogen bonds taken as native are the same for all peptides. They are (in protein G B1 residue numbering): E42(N)-T55(O), E42(O)-T55(N), T44(N)-T53(O), T44(O)-T53(N), D46(N)-T51(O), D46(O)-T51(N) and D47(O)-K50(N). fold_2 is an additional REX-MD folding simulation for GB1p using 16 replicas at 270-400 K, carried out to improve the convergence. Both folding and control simulations of HP5A used 16 replicas spanning 270-400K.

